Node Exporter, a lightweight Prometheus exporter, simplifies server monitoring by collecting comprehensive system metrics from Linux and Unix servers. This open-source tool provides real-time insights into CPU usage, memory, disk activity, and more. With easy installation and seamless integration with Prometheus, Node Exporter empowers You to monitor server health efficiently.
In this article I will show you how to install Node Exporter on your servers, How to scrape the metrics and how to visualize them.
Understanding Node Exporter
Node Exporter serves as a critical component in the Prometheus monitoring ecosystem, specializing in the collection of system metrics from Linux and Unix servers. This lightweight and efficient open-source tool act as a bridge between your servers and Prometheus, providing a rich set of metrics that are crucial for gaining insights into the health and performance of your infrastructure.
The primary role of Node Exporter is to expose a diverse range of machine-level metrics that Prometheus can scrape and store for analysis. This includes but is not limited to CPU and Memory Usage, Disk Activity, Network Traffic, and System Uptime.
By capturing these metrics, You will have comprehensive overview of your server’s behavior, analyze resource usage trends, detect irregularities in system behavior and identify and address bottlenecks.
Download Node Exporter
Node exporter is available for multiple CPU architectures including x86, AMD64, ARM (v5, v6, v7v and arm64) and MIPS.
All the binaries are available here : https://github.com/prometheus/node_exporter/releases. Here are the examples for AMD64 and ARMv7.
wget https://github.com/prometheus/node_exporter/releases/download/v1.7.0/node_exporter-1.7.0.linux-amd64.tar.gz
wget https://github.com/prometheus/node_exporter/releases/download/v1.7.0/node_exporter-1.7.0.linux-armv7.tar.gz
Installation Steps
Create Node Exporter User and Group:
sudo groupadd --system node_exporter
sudo useradd -s /sbin/nologin --system -g node_exporter node_exporter
Extract and move the binary:
tar -xvf node_exporter-*.tar.gz
cd node_exporter*
sudo cp node_exporter /usr/bin/
sudo chown node_exporter:node_exporter /usr/bin/node_exporter
Service Management
Create systemd service
sudo tee -a /usr/lib/systemd/system/node_exporter.service >/dev/null <<'EOF'
[Unit]
Description=Node Exporter
Documentation=https://prometheus.io/docs/guides/node-exporter/
Wants=network-online.target
After=network-online.target

[Service]
User=node_exporter
Group=node_exporter
Type=simple
Restart=on-failure
ExecStart=/usr/bin/node_exporter \
  --web.listen-address=:9000

[Install]
WantedBy=multi-user.target
EOF
sudo chmod 664 /usr/lib/systemd/system/node_exporter.service
Enable Node Exporter service
sudo systemctl daemon-reload
sudo systemctl enable node_exporter
sudo systemctl start node_exporter
Verify that the service is running
sudo systemctl status node_exporter
Scrape metrics with Prometheus
Open your prometheus.yml file and add update the scrape_configs by adding as follow :
scrape_configs:
  # The job name is added as a label `job=<job_name>` to any timeseries scraped from this config.
  - job_name: "prometheus"

    # metrics_path defaults to '/metrics'
    # scheme defaults to 'http'.

    static_configs:
      - targets: ["localhost:9090"]

  - job_name: 'node_exporter'
    scheme: http
    static_configs:
    - targets: ['localhost:9000']
After making changes to the Prometheus configuration, restart the Prometheus server to apply the new configuration.
sudo systemctl restart prometheus
Then verify that the service has been restarted without issues.
sudo systemctl status prometheus
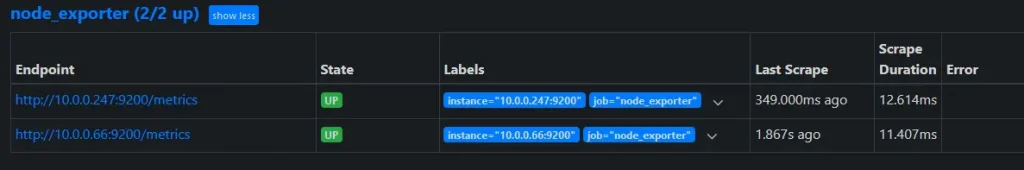
Now we can check that Prometheus can scrape the targets correctly. To do that, we can go to Prometheus’s menu Status -> Targets
Set Up Prometheus as a Data Source
In order to visualize the metrics we will need to connect from Grafana to prometheus. Here are the steps to follow :
- On the left sidebar and select “Data Source”
- Then click “Add new data source” button
- Choose “Prometheus” from the list of available data sources.
- In the “Connection” section, enter the URL of your Prometheus server (e.g.,
http://localhost:9090) in the “Prometheus server URL” field. - Click “Save & Test” to verify the connection to Prometheus.
Visualize Metrics On Grafana
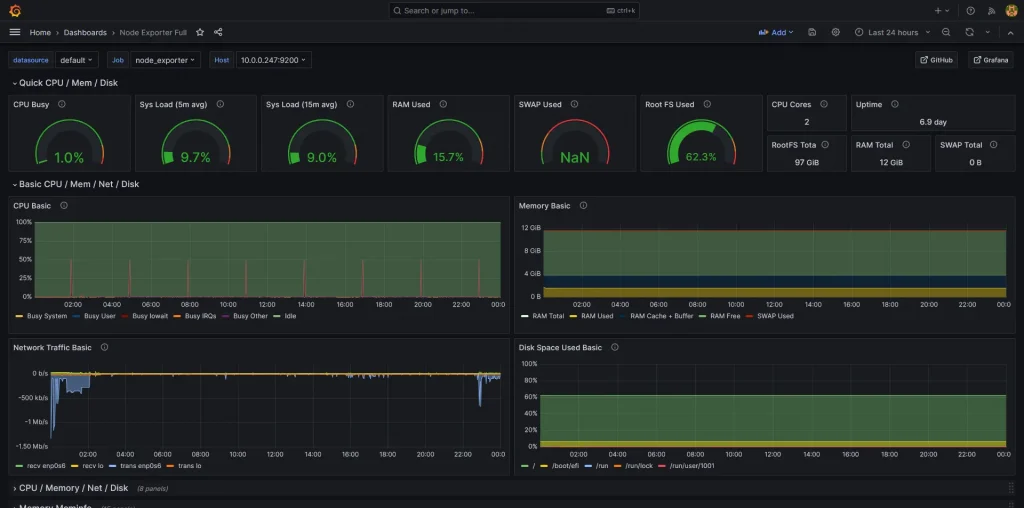
We will use node-exporter-full dashboard, it is a comprehensive dashboard specifically designed for visualizing metrics collected by Node Exporter.
- On the left sidebar and select “Dashboards”
- Then click “New” and the “Import”
- In the “Dashboard URL or ID” field, input the id : 1860. then click “Load”.
- Chose the Prometheus data source defined in the previous section.
- Click “Import”.