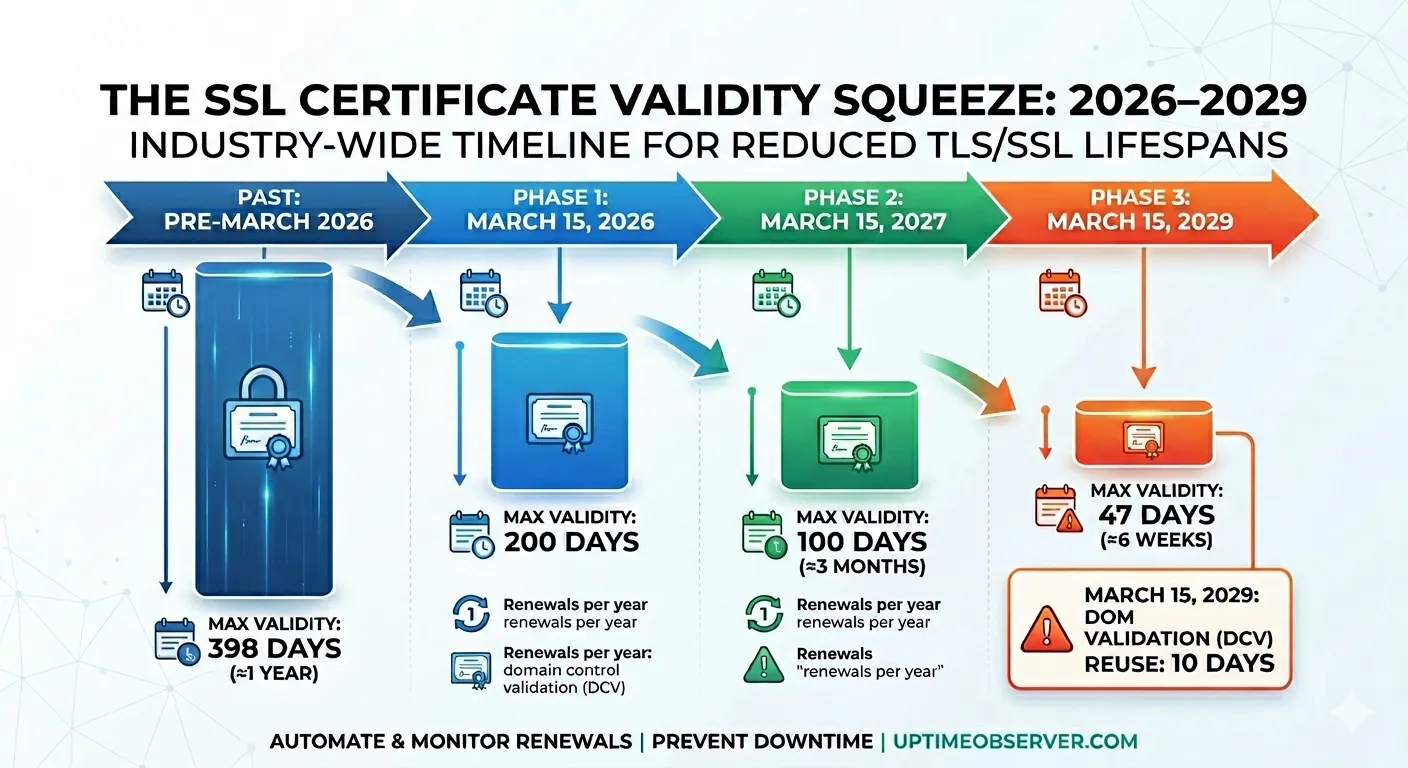
Understanding Availability: Comparing Nines for Business Excellence


Ensuring high availability is paramount for businesses striving to meet customer expectations and maintain a competitive edge. Availability is commonly expressed in terms of “nines” representing the percentage of uptime a service provides over a specific period. In this article, we’ll delve into the world of nines, comparing different levels and exploring their significance for […]


Read More


How Downtime Affects SEO and Ways to Mitigate the Impact


Website downtime can be a significant setback for businesses. Not only does it affect user experience, but it can also have a detrimental impact on your website’s search engine optimization (SEO). Search engines like Google prioritize websites that offer a seamless experience, and downtime can signal unreliability and can even get your website de-indexed. In […]


Read More


The Importance of Website Uptime for Business Success


Website uptime represents the lifeline of a business in the virtual realm. It goes beyond mere technical jargon, embodying the essence of your business’s reliability, credibility, and customer-centric approach. As consumers navigate the vast expanses of the internet, they demand seamless, instant access to information, products, and services. In this context, the uninterrupted functionality of […]


Read More


How to setup Node Exporter


Node Exporter, a lightweight Prometheus exporter, simplifies server monitoring by collecting comprehensive system metrics from Linux and Unix servers. This open-source tool provides real-time insights into CPU usage, memory, disk activity, and more. With easy installation and seamless integration with Prometheus, Node Exporter empowers You to monitor server health efficiently. In this article I will […]


Read More


How To Install Grafana on Ubuntu 22.04 LTS


Hey there data enthusiasts! Ever find yourself drowning in a sea of numbers and logs, desperately trying to make sense of it all? Enter Grafana, the superhero of data visualization! In a world where information overload is the norm, Grafana swoops in to save the day. It’s not just a tool; it’s your trusty sidekick […]


Read More


How To Install Prometheus on Ubuntu 22.04 LTS


Prometheus is an open-source systems monitoring and alerting toolkit originally developed by SoundCloud in 2012. It is designed for reliability and scalability in modern, dynamic environments. Prometheus is part of the Cloud Native Computing Foundation (CNCF) and has gained widespread adoption in the field of system monitoring. Prerequisites Download Prometheus Prometheus releases cater to a […]


Read More