When Facebook and Instagram went down for just over two hours in March 2024, Meta reportedly lost roughly 100 million in revenue and disrupted the digital lives of billions of users worldwide. With so much of our daily life and business happening online, maintaining a reliable online presence is more crucial than ever. Whether you run a website, an e-commerce platform, an API, or a web application, ensuring that your services are always accessible to users is non-negotiable. This is where uptime monitoring comes into play.
Understanding Uptime Monitoring
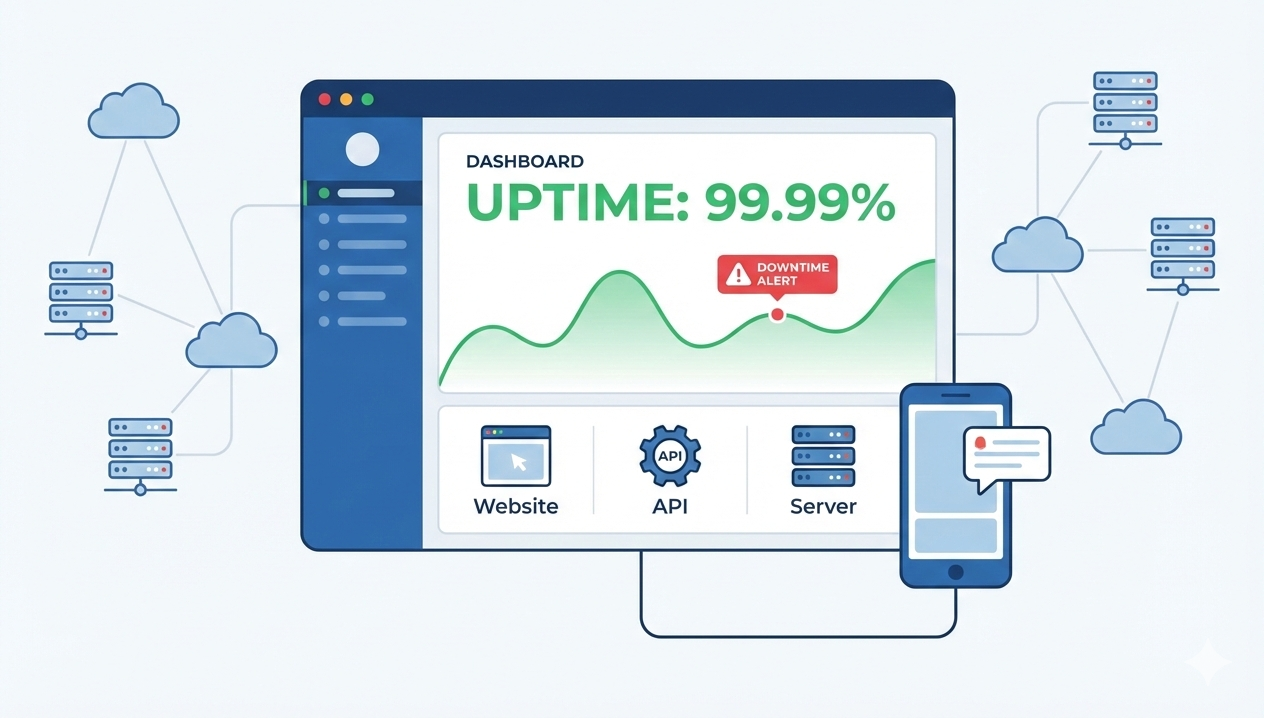
Uptime monitoring is the process of continuously tracking the availability and performance of your online services. By keeping an eye on your servers, websites, or applications, you can quickly detect and address issues that might affect their functionality or accessibility.
Uptime is usually expressed as a percentage, representing the total time a service is operational during a specific period—often a month or a year. For instance, an uptime of 99.9% translates to approximately 43 minutes of downtime per month. For a deeper dive into uptime metrics, check out our article: Understanding Availability: Comparing Nines for Business Excellence.
Why is Uptime Monitoring Important?
1. Customer Satisfaction
Users expect instant access to online services. Downtime can lead to frustration, loss of trust, and ultimately, lost customers.
2. Revenue Protection
For businesses, especially those in e-commerce or SaaS, downtime translates directly into lost revenue. Even a few minutes of unavailability can lead to thousands in missed sales and abandoned carts.
To understand the financial stakes for your specific business, you can use our Downtime Cost Calculator to estimate how much an outage could cost you per hour. For a deeper dive into these impacts, see our guide on The Importance of Website Uptime for Business Success.
3. Brand Reputation
Frequent outages can tarnish your brand’s image. Consistently high uptime demonstrates reliability and professionalism.
4. Problem Detection and Resolution
Uptime monitoring tools provide real-time alerts, allowing you to act swiftly when issues arise. This minimizes the impact of potential downtime.
How Does Uptime Monitoring Work?
Uptime monitoring tools work by regularly sending requests (or “pings”) to your servers or URLs. These tools assess whether the service responds correctly within an acceptable time frame. If a service fails to respond or returns an error, the monitoring tool records the incident and often notifies you via email, SMS, or other communication channels.
Types of Uptime Monitoring
1. Ping Monitoring
The simplest form of monitoring, where a tool checks if a server is reachable by sending a ping request.
2. HTTP Monitoring
Checks the status of a website or web application by sending HTTP requests and verifying the returned status codes (e.g., 200 OK, 404 Not Found).
3. TCP Port Monitoring
Ensures that specific ports on a server are open and accepting connections.
4. Application Monitoring
Monitors the functionality of specific applications or services, ensuring they perform as expected. This is usually done by calling healthcheck endpoints.
5. Synthetic Monitoring
Simulates user interactions with a website or application to test its functionality and performance.
Key Metrics to Monitor
To get the most out of uptime monitoring, tracking specific metrics is essential. Here are the key ones to keep an eye on:
1. Uptime Percentage
This is the core metric that measures the total availability of your service. Maintaining a high uptime percentage (e.g., 99.9% or higher) is crucial for ensuring reliability.
Different industries have varying benchmarks for uptime:
- E-commerce & SaaS: 99.9% (approximately 43 minutes of downtime per month) or higher.
- Financial Services & Banking: 99.99% (about 4 minutes of downtime per month) due to critical transaction requirements.
- Cloud & Hosting Providers: 99.95% to 99.999% (from ~22 minutes to ~26 seconds of downtime per month) for premium service levels.
- Healthcare & Emergency Services: 99.999% (often referred to as “five nines” uptime) to ensure minimal disruption in critical systems.
2. Response Time
Response time measures how long it takes for your server or application to respond to a request. A slow response time can indicate performance issues, even if the service is technically available.
Acceptable response times vary by service type:
- Websites & E-commerce: Under 3 seconds for optimal user experience.
- APIs & SaaS Platforms: Under 1 second for seamless integration.
- Real-time Applications (e.g., gaming, financial trading): Under 100 milliseconds to ensure smooth performance.
3. Downtime Duration
This metric tracks the total amount of time your service has been unavailable within a given period. It can be calculated using the formula:
Downtime Duration = (1 – Uptime Percentage) x Total Time Period
For example, if a service has an uptime of 99.9% over a month (30 days), the downtime duration would be:
Downtime Duration = (1 – 0.999) x 30 x 24 = 0.72 hours (or ≈ 43 minutes)
This metric tracks the total amount of time your service has been unavailable within a given period. Keeping downtime minimal is essential to maintaining user trust.
4. Error Rate
The percentage of failed requests versus total requests is an important indicator of service stability. A high error rate suggests underlying issues that need to be addressed.
5. Latency
Latency refers to the time taken for a request to travel from the user to the server and back. High latency can lead to poor user experiences, especially for real-time applications.
6. Service Availability by Region
Monitoring service availability from different geographic locations helps ensure a smooth experience for global users. Some issues may only affect specific regions due to localized infrastructure failures, ISP outages, or regulatory restrictions. For example, a cloud provider might experience downtime in one data center while other regions remain unaffected, or a specific country’s firewall policies might block access to certain services. Tracking availability by region allows businesses to proactively address these issues and ensure consistent performance worldwide.
Key Features of Uptime Monitoring Tools
- Real-time Alerts: Immediate notifications of downtime or performance issues.
- Global Monitoring: Monitoring from multiple locations worldwide to ensure global availability.
- Performance Metrics: Insights into response times and server performance.
- Historical Reports: Logs of past outages and performance trends for analysis.
Choosing the Right Uptime Monitoring Tool
When selecting an uptime monitoring tool, consider the following factors:
- Ease of Use: The tool should have an intuitive interface and be easy to configure.
- Alerting Options: Ensure it provides customizable and reliable notifications.
- Integration: Look for tools that integrate with your existing workflows, such as Slack or PagerDuty.
- Scalability: Choose a tool that can grow with your business needs.
- Cost: Compare pricing plans and choose one that fits your budget while offering essential features.
Conclusion
Uptime monitoring has evolved from a nice-to-have to a business necessity. The cost of downtime—whether measured in lost revenue, damaged reputation, or frustrated customers—far exceeds the investment in proper monitoring tools.
The most effective approach combines proactive monitoring with rapid response capabilities. By tracking key metrics, setting appropriate thresholds, and establishing clear escalation procedures, you can transform how your organization handles service reliability.
Tools like UptimeObserver provide the foundation for this approach, offering real-time monitoring, intelligent alerting, and comprehensive reporting. But the real value comes from using these insights to continuously improve your infrastructure and response times.
Getting started is simpler than you might expect. The question isn’t whether you can afford to implement uptime monitoring—it’s whether you can afford not to.
Frequently asked questions:
-
Can I monitor uptime for free?
Yes, many uptime monitoring services, including UptimeObserver, offer a free tier. These plans are perfect for personal blogs or small projects. While free plans often have longer check intervals (e.g., every 5 minutes), they provide the essential alerts you need to ensure your site is reachable without any upfront investment.
-
Does uptime monitoring affect site speed?
No, uptime monitoring has a negligible impact on site speed. Monitoring tools send lightweight "heartbeat" requests (like a PING or a HEAD request) that consume minimal server resources. In fact, monitoring helps improve your perceived speed by alerting you to slow response times before they impact your actual visitors.
-
What are the different types of notifications provided by uptime monitoring tools?
Uptime monitoring tools can alert you through multiple channels, including SMS, email, Slack, Discord, and webhooks, ensuring you’re promptly informed of any downtime or performance issues.
-
What are some common causes of server downtime?
Server downtime can be caused by hardware failures, software crashes, network issues, security breaches, traffic spikes, and scheduled maintenance. Identifying these risks helps in proactive mitigation.
-
How can I improve server uptime?
To enhance server uptime, implement best practices such as:
- Proactive monitoring to detect issues early.
- Regular backups to prevent data loss.
- Redundancy and failover setups to maintain service availability.
- Load balancing to distribute traffic efficiently.
- Security measures to prevent cyberattacks. -
What role does uptime monitoring play in incident response?
Uptime monitoring is crucial for incident response as it provides real-time alerts, allowing teams to respond swiftly, minimize downtime, and ensure uninterrupted service availability.

