Prometheus is an open-source systems monitoring and alerting toolkit originally developed by SoundCloud in 2012. It is designed for reliability and scalability in modern, dynamic environments. Prometheus is part of the Cloud Native Computing Foundation (CNCF) and has gained widespread adoption in the field of system monitoring.
Prerequisites
- Server running Ubuntu 22.04
- User with sudo privileges
- Hardware requirements depend on the use case
Download Prometheus
Prometheus releases cater to a variety of CPU architectures and instruction sets to ensure compatibility with diverse hardware environments. You can choose the appropriate version based on your specific CPU architecture, such as AMD64, ARM64, ARMv7…
The official Prometheus GitHub releases page (https://github.com/prometheus/prometheus/releases) provides a comprehensive list of available versions, each tailored to specific CPU architectures and instruction sets.
In this article we will provide two examples (AMD64 and ARMv7)
Download Prometheus for AMD64 :
wget https://github.com/prometheus/prometheus/releases/download/v2.48.0/prometheus-2.48.0.linux-amd64.tar.gz
Download Prometheus ARMv7:
wget https://github.com/prometheus/prometheus/releases/download/v2.48.0/prometheus-2.48.0.linux-armv7.tar.gz
Extract the package:
tar vxf prometheus*.tar.gz
cd prometheus*/
Installation Steps
Create Prometheus User and Group:
sudo groupadd --system prometheus
sudo useradd -s /sbin/nologin --system -g prometheus prometheus
Create the directories for the binaries
sudo mkdir /etc/prometheus
sudo mkdir /var/lib/prometheus
Move prometheus and promtool and change their owner to the user prometheus
sudo mv prometheus /usr/local/bin
sudo mv promtool /usr/local/bin
sudo chown prometheus:prometheus /usr/local/bin/prometheus
sudo chown prometheus:prometheus /usr/local/bin/promtool
Move prometheus.yml and change the owner to the user prometheus
sudo mv prometheus.yml /etc/prometheus
sudo chown prometheus:prometheus /etc/prometheus
Service Management
Create systemd service
sudo tee -a /etc/systemd/system/prometheus.service >/dev/null <<'EOF'
[Unit]
Description=Prometheus
Wants=network-online.target
After=network-online.target

[Service]
User=prometheus
Group=prometheus
Type=simple
ExecStart=/usr/local/bin/prometheus \
    --config.file /etc/prometheus/prometheus.yml \
    --storage.tsdb.path /var/lib/prometheus/ \
    --storage.tsdb.retention.time=1y \
    --web.listen-address="0.0.0.0:9090"

[Install]
WantedBy=multi-user.target
EOF
[Unit] Section
Description=Prometheus: Human-readable name for the serviceWants=network-online.target: Indicates the service desires network connectivityAfter=network-online.target: Ensures the service starts only after network is available
[Service] Section
User=prometheusandGroup=prometheus: Service runs under these dedicated security principalsType=simple: Basic service type where the main process is the one started by ExecStartExecStart=/usr/local/bin/prometheus: Command that launches Prometheus with options:--config.file: Points to configuration file at /etc/prometheus/prometheus.yml--storage.tsdb.path: Sets data storage location to /var/lib/prometheus/--storage.tsdb.retention.time=1y: Keeps time-series data for 1 year--web.listen-address="0.0.0.0:9090": Makes Prometheus listen on all network interfaces on port 9090
[Install] Section
WantedBy=multi-user.target: Ensures the service is started during normal system boot in multi-user mode
Enable prometheus service
sudo systemctl daemon-reload
sudo systemctl enable prometheus
sudo systemctl start prometheus
Verify that the service is running
sudo systemctl status prometheus
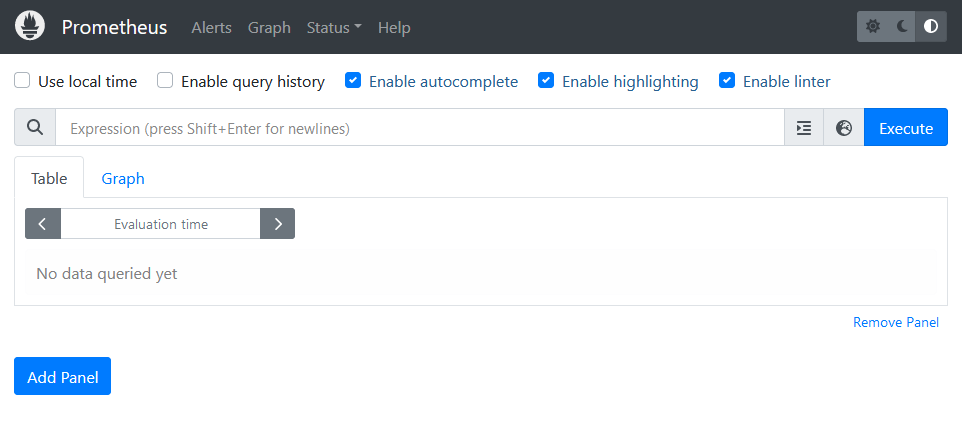
Accessing the Prometheus UI
The UI should be accessible with your browser using the IP of your server and port 9090.
Conclusion
Now that you have installed Prometheus successfully, you can start monitoring your servers with node exporter and Grafana.

