Hey there data enthusiasts! Ever find yourself drowning in a sea of numbers and logs, desperately trying to make sense of it all? Enter Grafana, the superhero of data visualization!
In a world where information overload is the norm, Grafana swoops in to save the day. It’s not just a tool; it’s your trusty sidekick in the quest for understanding your metrics, logs, and traces. From tech geeks to data dabblers, Grafana’s got something for everyone.
After installing Prometheus, we will install Grafana to visualize data from Prometheus (and many other Data Sources).
What You’ll Learn
By the end of this guide, you’ll have:
- A fully functional Grafana installation on Ubuntu 22.04 LTS
- Understanding of both OSS and Enterprise editions
- Knowledge of basic security configurations
- Next steps for connecting data sources
Prerequisites
| Requirement | Details |
| Operating System | Ubuntu 22.04 LTS (clean installation recommended) |
| User Privileges | sudo access for package installation |
| Hardware Requirements | Minimum: 1 CPU core, 512MB RAM, 1GB free disk space |
| Network Access | Internet connection for downloading packages |
| Optional | Basic familiarity with Linux command line |
Understanding Grafana Editions
Before installation, it’s important to understand the two available editions:
Grafana OSS (Open Source Software)
- Free and open-source
- Core visualization features
- Community support
- Perfect for small to medium deployments
Grafana Enterprise
- Commercial license required
- Advanced authentication (SAML, OAuth)
- Enhanced security features
- Priority support from Grafana Labs
- Advanced data source plugins
For this tutorial, we’ll show how to install both editions.
Prepare Your System
First, let’s ensure your Ubuntu system is up to date and install the necessary prerequisites:
# Update system packages
sudo apt update && sudo apt upgrade -y

# Install prerequisite packages
sudo apt-get install -y apt-transport-https software-properties-common wget curl gnupg2
What these packages do:
apt-transport-https: Enables APT to retrieve packages over HTTPSsoftware-properties-common: Provides tools for managing software repositorieswget&curl: Download tools for fetching keys and packagesgnupg2: Handles GPG key verification
Add Grafana Repository
Import the GPG key
First, create a directory for the GPG key and import Grafana’s signing key:
# Create directory for GPG keys
sudo mkdir -p /etc/apt/keyrings/

# Download and import Grafana's GPG key
wget -q -O - https://apt.grafana.com/gpg.key | gpg --dearmor | sudo tee /etc/apt/keyrings/grafana.gpg > /dev/null
Add the Repository
Add Grafana’s official repository to your system:
# Add Grafana repository for stable releases
echo "deb [signed-by=/etc/apt/keyrings/grafana.gpg] https://apt.grafana.com stable main" | sudo tee -a /etc/apt/sources.list.d/grafana.list
Update Package Lists
# Update package lists to include Grafana packages
sudo apt-get update
Install Grafana
Option A: Install Grafana OSS (Recommended for beginners)
sudo apt-get install grafana
Option B: Install Grafana Enterprise
sudo apt-get install grafana-enterprise
Note: Both installations use the same configuration files and follow the same setup process.
Configure and Start Grafana
Start the Grafana Service
# Reload systemd daemon
sudo systemctl daemon-reload

# Start Grafana server
sudo systemctl start grafana-server

# Check service status
sudo systemctl status grafana-server
You should see output similar to:

● grafana-server.service - Grafana instance
     Loaded: loaded (/lib/systemd/system/grafana-server.service; disabled; vendor preset: enabled)
     Active: active (running) since [timestamp]
Enable Auto-Start on Boot
# Enable Grafana to start automatically on system boot
sudo systemctl enable grafana-server
Verify Installation
# Check if Grafana is listening on port 3000
sudo netstat -tlnp | grep :3000
Access Grafana Web Interface
Initial Access
- Open your web browser
- Navigate to: http://YOUR_SERVER_IP:3000
- You should see the Grafana login page
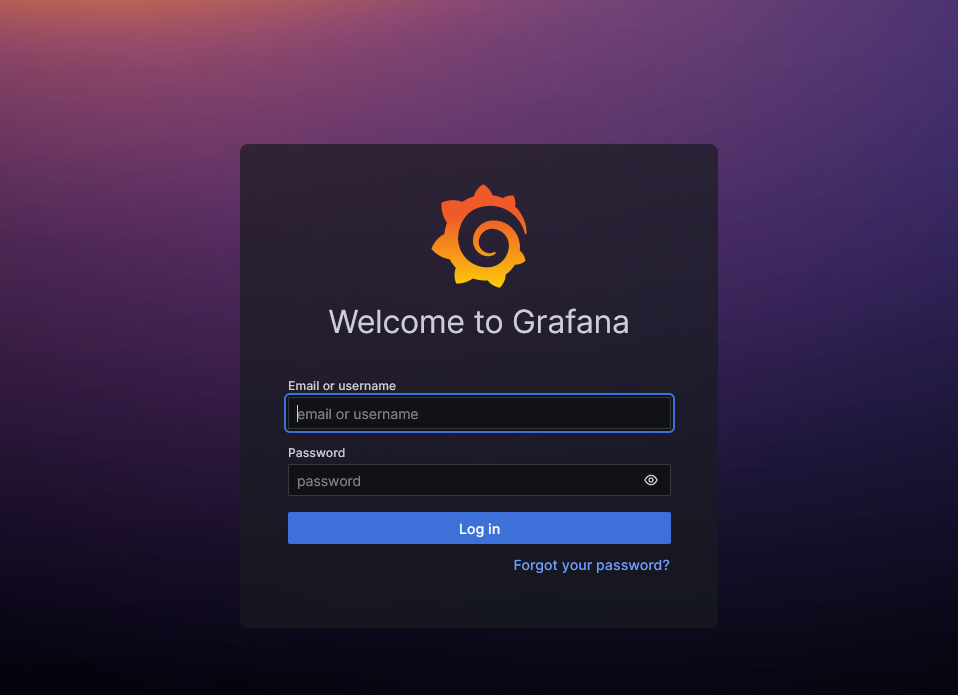
Default Credentials
- Username: admin
- Password: admin
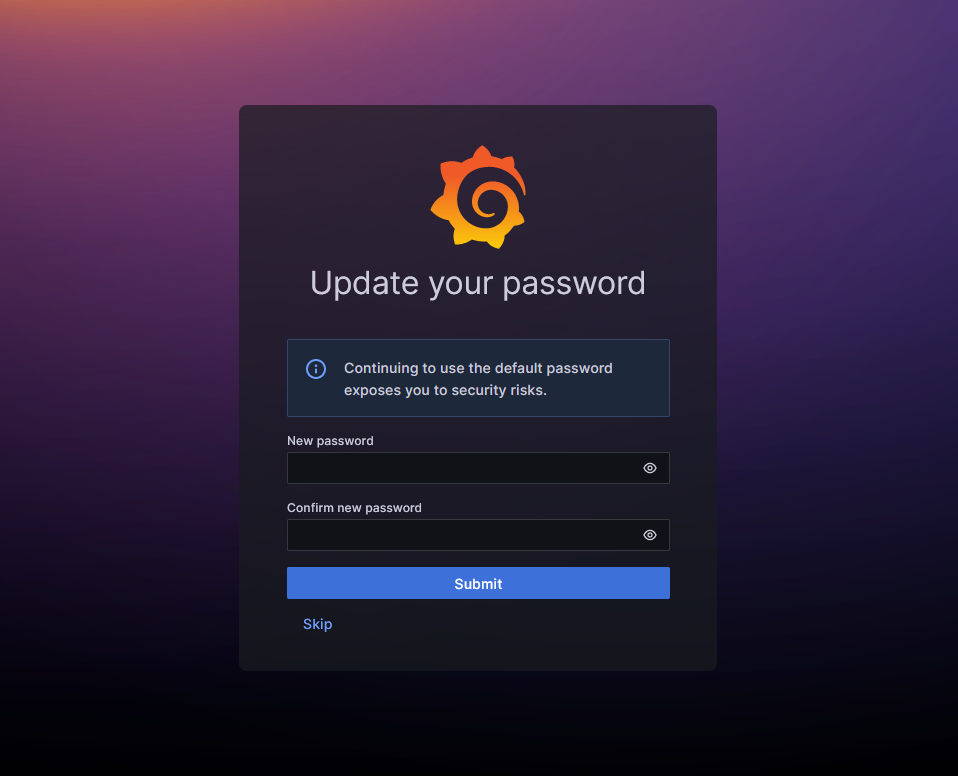
⚠️ Security Warning: Always change the default password immediately after first login!
First Login Process
- Enter the default credentials (admin/admin)
- Grafana will prompt you to create a new password
- Choose a strong password following these guidelines:
- At least 12 characters long
- Mix of uppercase, lowercase, numbers, and symbols
- Avoid common words or personal information
Verify Installation
Check Service Logs
# View Grafana logs
sudo journalctl -u grafana-server -f
Test Web Interface
- Navigate to your Grafana instance
- Log in with your new credentials
- You should see the Grafana home dashboard
Troubleshooting
Common Issues and Solutions
Grafana Won’t Start
# Check for port conflicts
sudo lsof -i :3000

# Check system logs
sudo journalctl -u grafana-server --no-pager
Can’t Access Web Interface
- Verify firewall settings
- Check if Grafana is binding to the correct interface
- Ensure port 3000 isn’t blocked
Permission Issues
# Fix Grafana file permissions
sudo chown -R grafana:grafana /var/lib/grafana
sudo chown -R grafana:grafana /var/log/grafana
sudo chown -R grafana:grafana /etc/grafana
Conclusion
Congratulations! You’ve successfully installed Grafana on Ubuntu 22.04 LTS. You now have a powerful visualization platform ready to transform your data into actionable insights.
Grafana’s true power lies in its ability to aggregate data from multiple sources and present it in meaningful ways. Whether you’re monitoring server performance, tracking application metrics, or analyzing business data, you’re now equipped with one of the most versatile visualization tools available.
What’s Next?
Consider exploring these related topics:
- Setting up Prometheus for metrics collection
- Configuring Node Exporter for system monitoring
- Creating your first custom dashboard
- Setting up automated alerts

